
Hyperliquid Leaderboard Explained: Account Value, PnL, ROI, Volume and How to Track Top Traders' Positions (2026)
Hyperliquid leaderboard guide: what the PnL, ROI, account value and volume columns mean, how to open a trader's positions, copy via vaults, James Wynn, 0xb317 and the caveats (2026).

The Hyperliquid leaderboard at app.hyperliquid.xyz/leaderboard ranks every trading address on the exchange by account value, PnL, ROI and volume over the last day, week, month or all time, and every row links to that trader's live positions. Because Hyperliquid runs a fully on-chain order book, nothing on the leaderboard is self-reported: it is computed from the same fills that settle on HyperCore. This guide explains each column, shows how to open a trader's positions page and follow it with a position tracker, covers vault copy-trading, names the traders people search for (James Wynn, the 0xb317 whale) and lists the caveats that make the leaderboard a worse signal than it looks.
Key takeaways
- Four metrics, four windows: account value, PnL, ROI and volume, each over 1 day, 7 days, 30 days or all time, sortable by column.
- Every row is clickable. You land on the trader's public positions page with open perps, entry prices, leverage and liquidation levels.
- Copy-trading is only native via vaults. If a leader runs a user vault you can deposit; otherwise you mirror manually with a Hyperliquid position tracker.
- PnL is not skill. It ignores leverage, drawdown, deposits and the thousands of blown-up accounts that never reach the top.
- Third-party trackers (HyperDash, Coinglass, Hypurrscan) add alerts, historical PnL curves and whale filters that the app's leaderboard does not have.
- As of September 2026 the top all-time PnL rows are market makers and a handful of discretionary whales; treat the list as a watchlist, not a recommendation.
What the Hyperliquid leaderboard shows
The leaderboard is a page inside the main Hyperliquid app, not a separate site. Open app.hyperliquid.xyz, click Leaderboard in the top navigation, and you get a table of addresses with a search box, a time-window toggle and sortable columns. It is public, requires no wallet connection and updates continuously as fills settle.
The exchange tracks every address that has ever placed a trade on HyperCore, including sub-accounts and vault addresses, so the full list runs to hundreds of thousands of rows. The default view sorts by account value, which puts the largest wallets first; most people switch to PnL or ROI and a shorter window to find who is actually making money right now.
Here is what each column means and how it is computed.
| Metric | What it measures | Windows | Watch out for |
|---|---|---|---|
| Account value | Total equity (margin + unrealised PnL) in USDC | Current only | Deposits inflate it; says nothing about skill |
| PnL | Realised + unrealised profit, net of fees and funding | 1D / 7D / 30D / all time | Not deposit-adjusted; huge accounts dominate |
| ROI | PnL divided by capital at the start of the window | 1D / 7D / 30D / all time | Tiny accounts post absurd percentages |
| Volume | Notional traded (perps + spot) | 1D / 7D / 30D / all time | Wash trading and market making inflate it |
| Direction / positions | Open perp side, size, leverage, liquidation | Live | Visible only on the trader page, not the table |
Account value
Account value is simply the equity of the address: USDC margin plus the unrealised PnL of open positions, plus spot balances valued at mark. It is the only column with no time window. It tells you how large an account is, which matters for sizing your expectations (a $50M account rarely moves 20% in a week) but says nothing about performance.
PnL
PnL is the dollar change in equity attributable to trading over the selected window: closed-trade profit, mark-to-market on open positions, funding received or paid, and fees. It does not subtract deposits or add back withdrawals, so a trader who closes a winning position and withdraws will still show the gain, while someone who tops up margin to avoid liquidation does not get credit for the deposit. For the all-time window the number reflects the entire history of the address, which is why market-making addresses with years of small edge sit near the top.
ROI
ROI divides PnL by the account's capital at the start of the window. This normalises for size and is the best single column for spotting hot hands, but it breaks on small accounts: an address that deposited $200 and ran 40x can show 5,000% ROI for a day and be gone the next. Filtering by a minimum account value (a feature third-party trackers offer and the native leaderboard does not) fixes most of the noise.
Volume
Volume is total notional traded. It is useful for identifying market makers (very high volume, modest PnL) versus discretionary whales (low volume, lumpy PnL), and for spotting addresses that are farming fee tiers or referral rewards. Spot volume counts at 2x toward Hyperliquid fee tiers, but the leaderboard reports raw notional.
How to read the Hyperliquid leaderboard like a professional
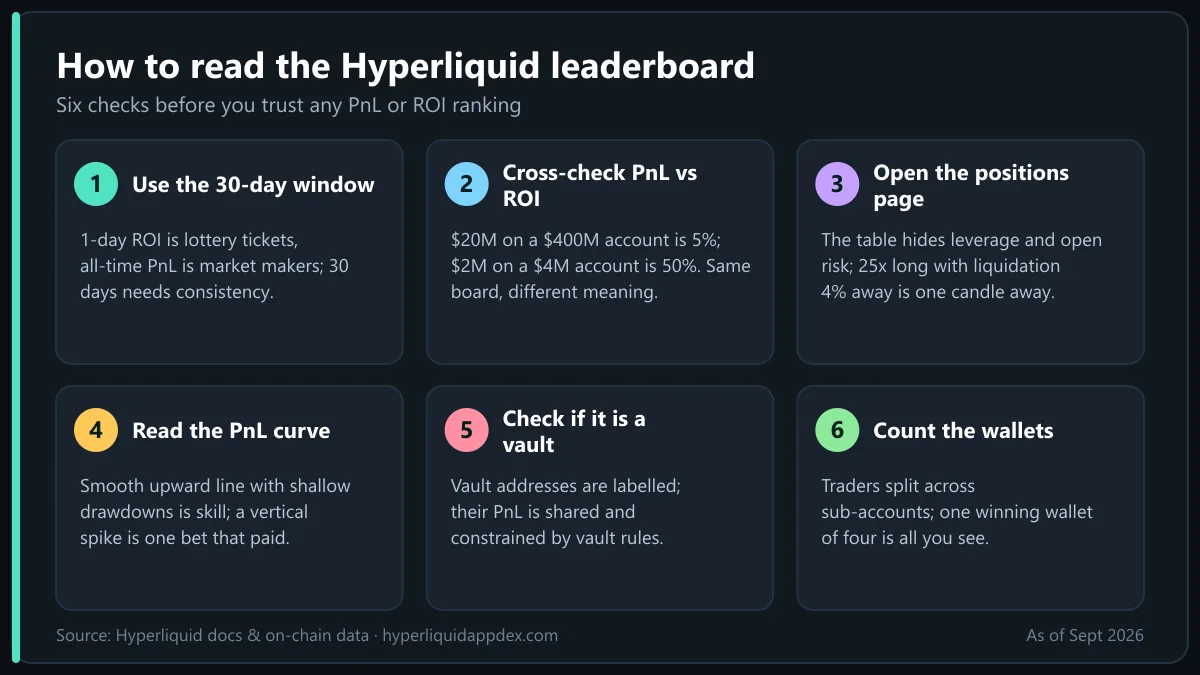
Raw rankings mislead. These are the filters and reads that experienced users apply before they pay attention to any name on the list.
- Pick the 30-day window first. One-day ROI is dominated by lottery tickets; all-time PnL is dominated by market makers and the exchange's own HLP vault. Thirty days is long enough to require some consistency and short enough to reflect the current regime.
- Cross-check PnL against ROI. A $20M PnL on a $400M account is 5%; a $2M PnL on a $4M account is 50%. Both appear near the top of different columns and mean completely different things.
- Open the positions page. The table does not show leverage or open risk. A trader up $10M who is currently 25x long BTC with a liquidation price 4% away is one candle from falling off the board.
- Look at the PnL curve, not the endpoint. HyperDash and Hypurrscan draw equity curves. A smooth upward line with shallow drawdowns is what skill looks like; a vertical spike is a bet that paid once.
- Check whether it is a vault. Vault addresses are labelled in the app. Their PnL is shared across depositors and their behaviour is constrained by vault rules, which is relevant if you plan to copy.
- Count the wallets. Serious traders split across sub-accounts and API wallets. A whale with one winning and three losing wallets only shows you the winner.
Everything you see is also exposed through the public API, so you can pull the same data programmatically with the /info endpoint and the clearinghouseState and userFills requests described in the Hyperliquid API guide.
Hyperliquid positions: opening a trader's page
Click any address and the app takes you to that trader's public profile, which is the same view a trader sees of their own account minus the ability to act. The page has four parts that matter:
- Positions: each open perp with side, size, notional, entry price, mark price, leverage and margin mode, liquidation price, unrealised PnL and funding accrued. This is the "hyperliquid positions" data that most whale-watching accounts on X screenshot.
- Open orders: resting limit orders, TP/SL triggers and TWAPs. Resting bids far below market tell you where a whale wants to add.
- Trade history: every fill with timestamp, price, size and fee, going back as far as you care to scroll.
- Funding and deposits: funding paid or received per position and, on the explorer view, deposits and withdrawals through the bridge.
The address bar carries the wallet, so you can bookmark app.hyperliquid.xyz/explorer/address/0x... or paste it into Hypurrscan or HyperScan for a richer view that includes HyperEVM activity, staking and spot holdings.
Reading liquidation risk from the positions page
The most useful number on a whale's positions page is the distance between mark and liquidation price. Hyperliquid's maintenance margin is half the initial margin at the position's maximum leverage, so a 40x BTC position is liquidated after roughly a 1.25% adverse move once margin is exhausted, while a 5x position has around 10% of room. Traders who sit near liquidation and keep topping up margin are the ones who generate the dramatic "whale liquidated for $100M" headlines. The leverage and liquidation guide covers the exact formulas.
Hyperliquid position tracker tools beyond the app
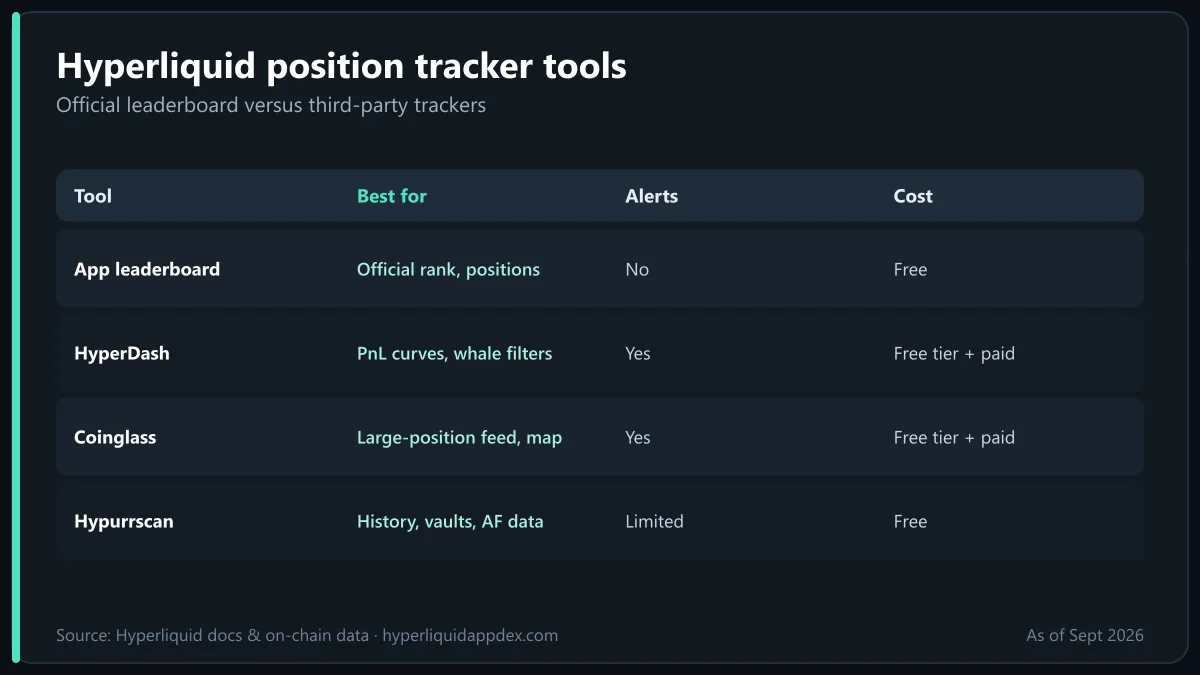
The native leaderboard is deliberately minimal. Three third-party tools fill the gaps, and most serious watchers use at least two.
| Tool | Best for | Alerts | Cost |
|---|---|---|---|
| Hyperliquid app leaderboard | Official ranking, instant positions view | No | Free |
| HyperDash | PnL curves, whale filters, labelled wallets, Telegram alerts | Yes | Free tier + paid |
| Coinglass Hyperliquid whale tracker | Large-position feed, liquidation map, cross-exchange context | Yes | Free tier + paid |
| Hypurrscan | Explorer-style history, vault stats, Assistance Fund, HIP-3 data | Limited | Free |
HyperDash is the closest thing to a dedicated Hyperliquid position tracker: it maintains a database of labelled addresses (market makers, known whales, funds), plots historical PnL for any wallet, lets you filter the leaderboard by minimum account value and window, and sends Telegram or Discord alerts when a tracked wallet opens, closes or gets liquidated.
Coinglass runs a Hyperliquid whale-position feed alongside its liquidation heatmaps. Its advantage is context: you can see a whale's Hyperliquid short next to aggregate open interest and funding on Binance and Bybit, which helps you judge whether the position is a directional bet or part of a hedge.
Hypurrscan is an explorer first, but its address pages show full history, vault performance and spot balances, and its Assistance Fund page is the standard reference for HYPE buybacks.
If you want something custom, the whole leaderboard is reproducible from the public API and from the HyperEVM precompiles, which is how Dune dashboards and most Telegram bots are built. See the whale tracker guide for a step-by-step on wiring up alerts.
👉 Open the Hyperliquid app and save 4% on fees
Copy trading leaderboard traders through vaults
Hyperliquid has no built-in "copy this address" button. Copy trading exists through vaults: any address can open a user vault, depositors put in USDC, and the vault leader trades the pooled balance. Depositors receive the vault's PnL pro rata, the leader keeps 10% of profits as a performance fee, and withdrawals are subject to a lock-up (historically one day after deposit, and the leader must keep at least 5% of the vault's capital).
That means the practical workflow for copying a leaderboard trader is:
- Open the trader's page and check whether the address is labelled as a vault, or search the Vaults tab for the same name.
- Review the vault's equity curve, max drawdown, age, total depositors and leader share. A vault that is three weeks old with a 300% return is a different proposition from one with 18 months of history.
- Deposit USDC from your perps balance. You are now exposed to every trade the leader makes with the vault's capital, at the leader's chosen leverage.
- Monitor. Vault leaders can change strategy, and the lock-up means you cannot exit mid-drawdown instantly.
Many top leaderboard addresses are not vaults, and the biggest discretionary whales rarely run one, because vault rules constrain their behaviour and publicise their book. For those you are left with manual mirroring: set an alert on the address, open a smaller version of the position, and manage your own exits. The vaults and HLP guide covers the mechanics and the fee split in detail.
Risk note: vault returns are not guaranteed, leaders can lose depositor funds in a single liquidation, and past leaderboard rank is a weak predictor of future performance.
Famous names on the Hyperliquid leaderboard
Searches for "hyperliquid leaderboard" are often really searches for a specific trader. These are the addresses that get the most attention, and what they illustrate.
James Wynn
James Wynn is the trader most associated with the leaderboard. Through spring 2025 he ran BTC longs above $1B in notional at 40x leverage, briefly posted PnL near the top of the 30-day board, then suffered a chain of liquidations that erased most of the gains and turned his address into the most tracked wallet on HyperDash and Coinglass. He later returned with smaller positions, and his public swings (and complaints about being hunted) are a case study in why leaderboard PnL without drawdown data is meaningless. If you look him up today, read the equity curve, not the headline number.
The 0xb317 whale
The address beginning 0xb317… is the well-known whale wallet tracked by Coinglass and HyperDash. It has repeatedly carried nine-figure BTC and ETH perp positions, sometimes on both sides across time frames, and its entries are reposted on X within minutes. Unlike Wynn it is anonymous, trades with lower leverage and shows a far smoother PnL profile, which is why tracker users treat its positioning as a sentiment input rather than a copy target.
Market makers and the HLP vault
The all-time PnL and volume columns are dominated by market-making firms and by the exchange's own HLP vault, which earns from providing liquidity and from liquidations. These rows are stable, high-volume and low-ROI; they are useful for understanding where exchange liquidity comes from but not something a retail account can imitate.
Insider and "hedge" wallets
Periodically an address opens a large, well-timed position hours before major news (tariff announcements, listings, the October 10, 2025 crash) and the leaderboard spikes. These wallets attract accusations of insider trading and sometimes investigations by on-chain sleuths. Whatever the truth, they are single-event outliers, not strategies.
Caveats: why leaderboard PnL is not a track record
Every ranking of trading accounts has the same statistical problems, and the on-chain transparency of Hyperliquid makes them visible rather than solving them.
- Survivorship bias. You see the ten addresses that made $10M at 40x; you do not see the thousands that tried the same thing and were liquidated. The leaderboard is the right tail of a distribution whose mean is negative after fees.
- Leverage is invisible in the table. PnL and ROI do not distinguish a 2x swing trade from a 40x gamble. Only the positions page shows the risk taken.
- Deposits distort. Account value and PnL are not flow-adjusted. A fund that deposits $100M looks like a whale that "made" it over time if you misread the window.
- Wash volume. Volume rank can be bought: trading against yourself across two wallets costs only fees and is sometimes done to reach VIP tiers or for airdrop farming. Volume is not evidence of skill.
- Wallet fragmentation. One trader, five wallets, one winner on the board.
- Window effects. Thirty-day ROI resets; a trader can be #1 in March and underwater in April with no trace of the drawdown in the May ranking.
- Regime dependence. A board full of leveraged longs after a 40% BTC rally tells you about the rally, not about the traders.
None of this means the leaderboard is useless. It is an excellent discovery tool for finding addresses worth studying, and because every trade is public you can do the forensic work (equity curve, max drawdown, average leverage, win rate by market) that would be impossible on a centralised exchange. Just do the work before copying anyone.
Using the leaderboard to improve your own trading
A less obvious use of the leaderboard is as a mirror. Your own address is on it. Search for it, switch between windows and ask the questions you would ask of a whale: is the ROI coming from one trade or many, how far from liquidation do you sit on average, and does your volume (and therefore your fee bill) justify your PnL? The trading strategies guide walks through the approaches (funding arbitrage, hedge mode, basis trades) that tend to produce the smooth curves you want to see on your own page, and the how to trade on Hyperliquid guide covers order types and margin modes.
If you are new, start on the Hyperliquid app DEX with a small isolated-margin position and treat the leaderboard as reading material. The traders at the top did not get there by copying the people at the top the week before.
Bottom line
The Hyperliquid leaderboard is a free, public, on-chain ranking of every trading address by account value, PnL, ROI and volume, and it is the fastest way to find whale positions, vault leaders and traders worth studying. Its weakness is that it shows outcomes without risk: no leverage, no drawdown, no deposits and no view of the accounts that failed. Pair it with a Hyperliquid position tracker such as HyperDash or Coinglass for alerts and equity curves, copy only through vaults with real history, and remember that the James Wynn story is the typical ending for 40x PnL leaders, not the exception.
Frequently Asked Questions
Where is the Hyperliquid leaderboard?
The official leaderboard lives inside the app at app.hyperliquid.xyz/leaderboard. It ranks every address that has traded on HyperCore by account value, PnL, ROI and volume over a day, week, month or all time. No login is needed to view it, and clicking an address opens that trader's public positions page.
What does PnL mean on the Hyperliquid leaderboard?
PnL is the dollar profit or loss of an address over the selected window, combining realised gains, unrealised gains on open positions, funding paid or received and fees. It is not adjusted for deposits or withdrawals, which is why ROI is shown alongside it. A large PnL on a huge account can be a small percentage move.
How do I see a Hyperliquid trader's open positions?
Click any row on the leaderboard, or paste the address into app.hyperliquid.xyz/explorer, Hypurrscan or HyperDash. You will see open perp positions with side, size, entry price, leverage, liquidation price and unrealised PnL, plus recent fills and the order history. Everything on Hyperliquid is on-chain and public.
Can I copy trade the top traders on the Hyperliquid leaderboard?
Only if the trader runs a vault. User vaults let depositors share a leader's trades in proportion to their deposit, with the leader keeping 10% of profits. Otherwise you can only mirror positions manually using a position tracker and alerts. Past leaderboard rank does not predict future returns.
Who is James Wynn on Hyperliquid?
James Wynn is a trader who became famous in 2025 for running billion-dollar-notional BTC positions at 40x leverage on Hyperliquid, topping the PnL leaderboard and then giving most of it back in a run of liquidations. His address became the most watched on whale trackers and is a cautionary example of leverage risk.
Is the Hyperliquid leaderboard accurate?
The numbers are computed from on-chain fills and are accurate for each address, but the ranking suffers from survivorship bias, hides leverage and drawdowns, can be inflated by wash volume, and splits one trader across many wallets. Treat it as a discovery tool, not a verified track record.

Trading on Hyperliquid since the 2024 points seasons. Follow on X · LinkedIn · YouTube
Ready to trade on the Hyperliquid app?
Open the official Hyperliquid DEX with our referral link and get a lifetime 4% discount on trading fees. No KYC, no gas fees, self-custody.
Open Hyperliquid App · Save 4%Disclaimer: This article is for educational purposes only and is not financial, investment or legal advice. Perpetual futures trading with leverage carries a high risk of loss. Read our full disclaimer.