
Hyperliquid Liquidation Map and Heatmap Explained: How Coinglass and HyperDash Build It, How to Read Clusters and Use It for Entries and Stops (2026)
Hyperliquid liquidation map guide: dodge stop hunts and set safer stops by reading the Coinglass and HyperDash heatmaps, clusters, magnets and cascades (2026).

A Hyperliquid liquidation map shows you where the market is most likely to be pulled and where your stop is most likely to be hunted: price level by price level, it charts how much leveraged position value would be forcibly closed if the market got there. Because every position on Hyperliquid is on-chain and public, tools such as Coinglass and HyperDash can build a far more precise heatmap for Hyperliquid than for Binance or Bybit, where the data must be modelled from aggregates. Our guide explains how the Hyperliquid heatmap is built, how to read clusters and "magnets", how to use it for entries, stops and avoiding stop hunts, what happened on the record liquidation day of October 10, 2025, and where the tool breaks down.
Key takeaways
- A liquidation map estimates liquidation volume at each price; a liquidation heatmap adds the time axis, so you can watch those levels build and get cleared.
- On Hyperliquid, positions, leverage and liquidation prices are public on-chain data, so you read real positions rather than statistical guesses.
- Bright clusters act as magnets: price tends to move toward dense liquidation zones because closing those positions creates forced market orders in that direction.
- Use the map to place stops outside dense bands, to fade exhausted cascades, and to avoid entering just before a cluster gets swept.
- Hyperliquid-specific inputs include hourly funding, open interest by coin and the HLP backstop; October 10, 2025 (~$10B+ liquidated) is the case study.
- Limits: the map does not see hedges on other venues, added margin or cancelled stops. It is a probability tool, not a prediction.
What a Hyperliquid liquidation map (heatmap) is
Every leveraged perp position has a liquidation price: the level at which the position's margin no longer covers the maintenance requirement and the exchange force-closes it. Knowing where thousands of those prices stack up is the edge the map gives you. On Hyperliquid, maintenance margin is half the initial margin at max leverage, so a 40x BTC long is liquidated after roughly a 1.25% adverse move while a 5x long survives about a 10% move. Our Hyperliquid leverage guide walks through the formula.
Now imagine summing the notional size of every open position at its liquidation price. You get a histogram across price: tall bars where many positions share a liquidation level, short bars where few do. That histogram is the Hyperliquid liquidation map. Plot it over time, with colour intensity instead of bar height, and you have the Hyperliquid liquidation heatmap: a chart where the x-axis is time, the y-axis is price and brightness shows accumulated liquidation leverage at each level.
Two features of Hyperliquid make the map unusually useful:
- Transparency. Every wallet's positions, entry price, leverage, margin mode and liquidation price are queryable from the public API (
clearinghouseState) or on explorers such as Hypurrscan. There is no need to estimate. - Concentration of leverage. Hyperliquid routinely handles 60 to 70% of on-chain perp volume and billions in open interest, and its whales (think of the well-known address 0xb317… tracked by Coinglass and HyperDash) run positions large enough that a single liquidation moves the market.
In Vietnamese search the question often appears as liquidation map là gì: it is the "map of forced-closure prices" and the logic is identical.
How Coinglass and HyperDash build the Hyperliquid heatmap
The two most-used tools take slightly different approaches, and knowing the difference tells you how much to trust each band.
Coinglass Hyperliquid liquidation map and heatmap
Coinglass offers a dedicated Hyperliquid section alongside its CEX data. For the Coinglass Hyperliquid heatmap it combines:
- Open interest by market (BTC, ETH, SOL, HYPE and the rest), pulled from the Hyperliquid API.
- Leverage distribution. For CEXs Coinglass assumes typical leverage bands (5x, 10x, 25x, 50x, 100x) and distributes OI across them to estimate where liquidations would sit. For Hyperliquid it can read actual position leverage, which tightens the estimate.
- Price history, to decay or clear bands once price has traded through them (the positions would already be liquidated or closed).
The output is a price-by-time grid; brighter yellow means more leverage would be liquidated there. Coinglass also publishes a Hyperliquid liquidation map view (a snapshot histogram of cumulative long and short liquidation value above and below current price) and a whale tracker listing large positions with their liquidation prices.
HyperDash liquidation map
HyperDash is Hyperliquid-native analytics. Its liquidation map is built directly from the positions of every tracked wallet, so each bar is literally the sum of real liquidation prices rather than a model. It shows:
- Cumulative long liquidations below price and short liquidations above, in USD.
- The largest individual positions contributing to each cluster, with wallet links.
- Per-coin breakdowns (BTC, ETH, HYPE, SOL and smaller alts), which matter because alt clusters often sit much closer to price.
The trade-off is scope: HyperDash sees only Hyperliquid. If a whale is long on Hyperliquid and hedged short on Binance, the HyperDash bar overstates the pressure. Coinglass can show both venues side by side.
Other sources
Hypurrscan logs liquidation events after the fact (useful for checking whether a cluster actually cleared). The in-app trade feed flags liquidation fills. Several Telegram and X bots post Hyperliquid liquidations above a threshold. See the Hyperliquid explorer and Hyperliquid whale tracker guides for setup.
How to read clusters, magnets and empty zones
Reading a Hyperliquid heatmap is mostly pattern recognition, and five patterns cover most of what you need:
Dense clusters ("magnets"). A bright horizontal band means a lot of leverage is liquidated at that level. Price tends to gravitate toward these bands for a mechanical reason: when liquidations fire, the exchange sells (for longs) or buys (for shorts) at market, pushing price further in the same direction and triggering the next layer. Market makers and large traders know this and often position for the sweep.
Asymmetry. If the clusters below price are far brighter than those above, the market is long-heavy: a dip will cascade harder than a rally. On Hyperliquid you can cross-check this with the long/short ratio and with Hyperliquid funding: strongly positive hourly funding plus a bright band below price is a classic setup for a long squeeze.
Distance. A cluster 1% away is in play within the hour on a volatile day. A cluster 15% away is background information. HyperDash's per-coin view is useful here because HYPE or SOL clusters sit closer than BTC's.
Cleared zones. Once price trades through a band it goes dark: those positions are gone. A big cleared band followed by a sharp reversal is the signature of a stop hunt or liquidation sweep.
Build-up over time. On the heatmap, bands that brighten over several days as price consolidates indicate traders piling into the same leveraged trade. The longer the build, the more violent the eventual clear.
Using the Hyperliquid liquidation map for entries, stops and stop-hunt avoidance
The heatmap is a context tool that sharpens your entries and protects your stops. Here is how experienced Hyperliquid traders fold it into decisions; none of this is a guarantee of profit, and leverage can lose your whole margin.
Entries
- Fade the exhausted sweep. Wait for price to run through a dense cluster, watch volume and the liquidation feed spike, then enter in the opposite direction once the cascade stalls. The idea is that forced sellers are done and the move was mechanical rather than informational.
- Ride toward the magnet. If price is trending toward a bright band with little resistance in between, a continuation trade to the cluster has a defined target.
- Avoid entering just below a bright band in the trade's direction. If you go long 0.5% above a dense long-liquidation cluster, you are the liquidity the sweep will take.
Stops
- Place stops beyond the nearest dense cluster, not inside it. A stop sitting in the middle of a bright band will be hit by the sweep even if your thesis is right.
- Use isolated margin on Hyperliquid so a liquidation on one position cannot drain your whole account; our Hyperliquid portfolio margin guide explains the difference.
- Size so that your own liquidation price is far outside any visible cluster. If your liquidation price lands in a bright band, you are part of the magnet.
Avoiding stop hunts
Large players sometimes push price into a cluster deliberately. Signs you are about to be hunted: a bright, nearby cluster; thin order-book depth between price and the cluster; funding paying heavily against the crowded side. In that situation, either widen your stop beyond the band with a smaller position, or step aside until the band is cleared.
👉 Open the Hyperliquid app and save 4% on fees
SIXPROSPERHyperliquid-specific data that improves the map
Hyperliquid publishes more than most venues, and using all of it makes your read of the map far more reliable:
- Hourly funding. Funding is paid every hour (capped at 4% per hour) rather than every eight hours. A sustained high positive rate means longs are crowded and paying; combine with the heatmap to judge which side is likelier to cascade.
- Open interest by coin. The
metaAndAssetCtxsendpoint returns OI per market; a sudden OI jump without price movement means new leveraged positions, which will show up as a fresh band. - Public liquidation prices. Each wallet's
liquidationPxis visible, so for the top 100 positions you can verify a cluster by hand. - HLP backstop. Positions above a size threshold are liquidated by the HLP vault rather than the open book, which softens the market impact of whale liquidations. See the Hyperliquid HLP guide.
- Auto-deleveraging (ADL). When HLP cannot absorb a loss, profitable traders on the other side are deleveraged. Heatmaps do not show ADL, but a cluster being cleared on a thin book is where ADL risk is highest.
- HIP-3 markets. Stock, index and commodity perps have their own OI and liquidation levels; heatmap coverage of these is still partial, so check deployer dashboards.
Also useful: the Hyperliquid API lets you pull all of the above and build your own map in a few dozen lines of Python.
Case study: October 10, 2025, the record liquidation day
On October 10, 2025 a macro shock triggered the largest liquidation event in crypto history. Industry-wide estimates ran to around $19 billion of forced closures in 24 hours; Hyperliquid alone processed more than $10 billion in notional liquidations, by far its record, with no downtime.
What the heatmap showed, in sequence:
- Before: days of consolidation had built thick long-liquidation bands 3 to 8% below BTC and ETH, and much closer bands on alts. Funding was positive. The map was screaming "long-heavy".
- The trigger: a sharp sell-off in the futures market pushed BTC into the first band. Liquidations fired, market sells hit the book, price fell into the next band.
- The cascade: within roughly an hour, price cut through every visible cluster. Alts with thin books fell 30 to 60% intraday. On some markets HLP absorbed liquidations faster than the book could, and ADL was applied to profitable shorts.
- After: the map below price was almost entirely dark. The subsequent rebound was fast precisely because there was nothing left to liquidate on the way down and shorts opened during the crash became the new cluster above.
Lessons: the map was an excellent warning of fragility (too much leverage on one side), a poor timing tool (the bands sat there for days), and useful afterwards for identifying the exhaustion point. The Hyperliquid news page has the broader timeline, and our Hyperliquid safety guide covers how HLP and ADL behaved.
Limitations of liquidation heatmaps
Be clear about what the tool cannot do, so it never becomes your only reason for a trade:
- It is an estimate of pressure, not a forecast. Price does not have to visit a cluster, and clusters shift as traders add margin, partially close or move stops.
- Hedges are invisible. A position long on Hyperliquid and short elsewhere is not a true liquidation risk, but it brightens the band.
- Market makers' positions distort it. Large neutral market-making inventories show up as leverage even though they are hedged continuously.
- Thin-market artefacts. On small HIP-1 spot tokens or new HIP-3 markets a single wallet can create a "cluster".
- Latency. Coinglass refreshes on an interval; HyperDash is closer to real-time but still lags the chain. In a cascade, the map you are looking at is already stale.
- Self-fulfilling and anti-fulfilling. Because everyone sees the same map, obvious clusters sometimes get front-run, and the sweep happens earlier or not at all.
Treat the heatmap as one input alongside order-book depth, funding, OI and the macro tape. Leverage trading carries a real risk of losing your entire margin.
Step-by-step: view a BTC or HYPE liquidation heatmap
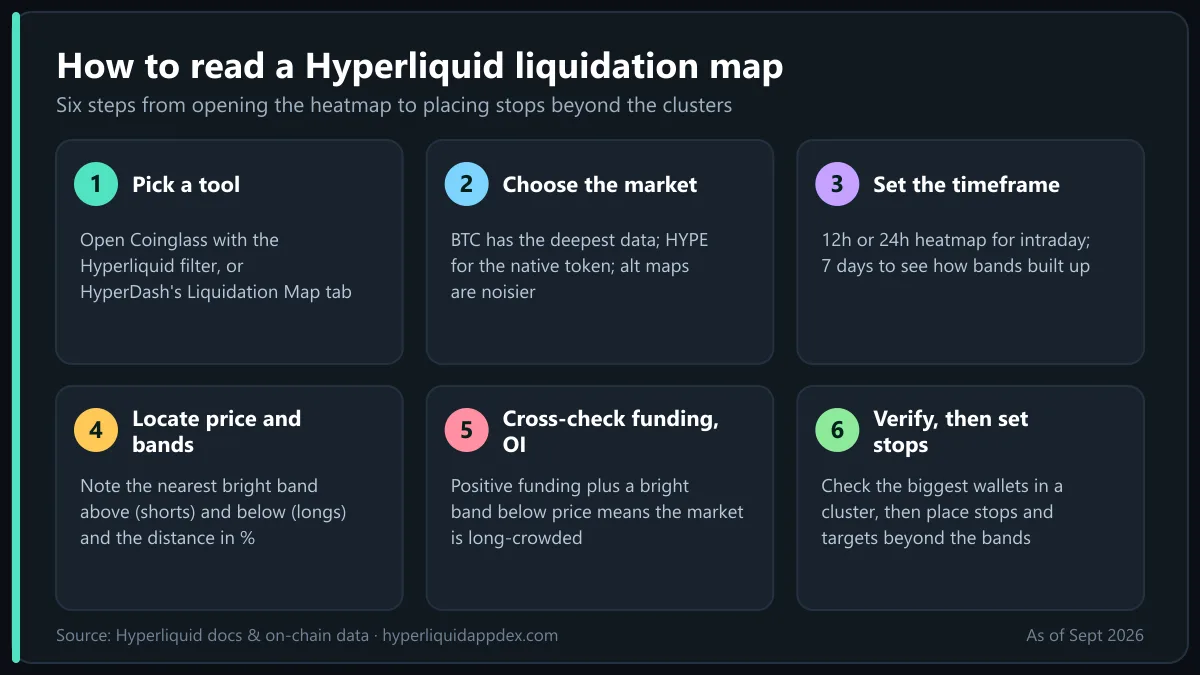
- Pick a tool. Open Coinglass and select Hyperliquid in the exchange filter, or open HyperDash and choose the Liquidation Map tab.
- Choose the market. Select BTC for the deepest data or HYPE for the chain's native token; alt maps are noisier.
- Set the timeframe. For intraday trading use the 12-hour or 24-hour heatmap; for swing positions use 7 days to see how bands built up.
- Locate current price and note the nearest bright band above (short liquidations) and below (long liquidations), plus the distance in percent.
- Cross-check funding and OI on the Hyperliquid app or the Hyperliquid dashboard data tabs: positive funding plus a bright band below means long-crowded.
- Verify the biggest contributors on HyperDash or the leaderboard: if two wallets make up most of a cluster, it can vanish with a single margin top-up.
- Decide stops and targets relative to the bands, then place the trade on the Hyperliquid app DEX.
Hyperliquid heatmap and liquidation tools compared
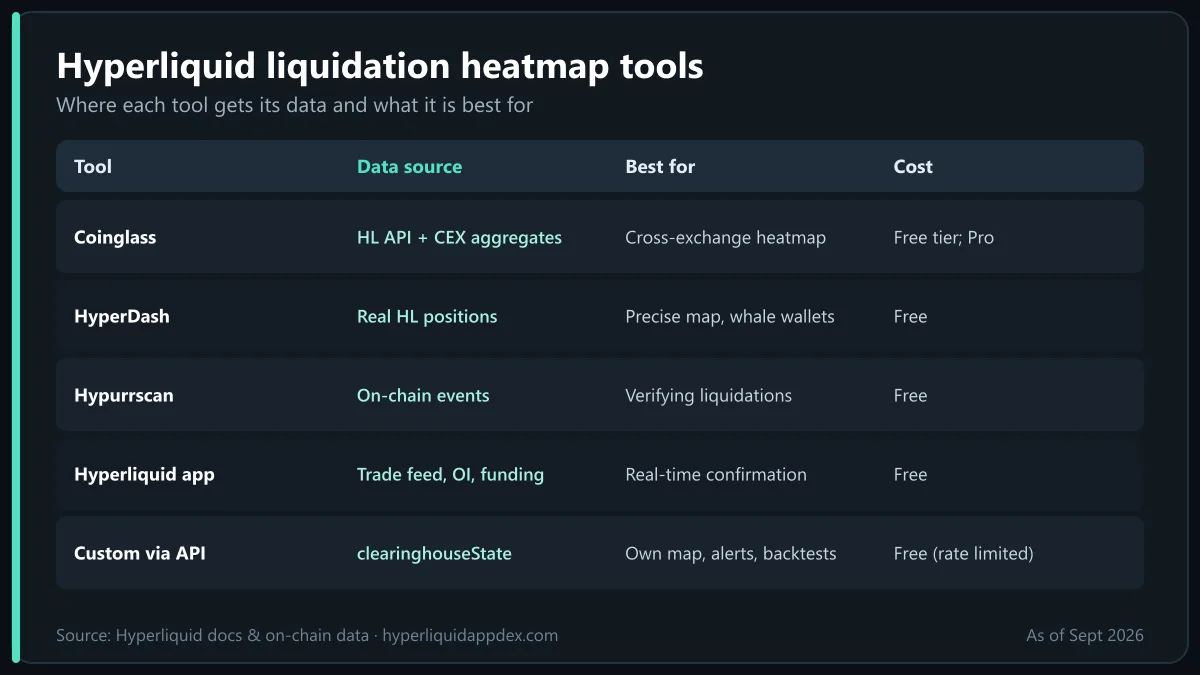
| Tool | Data source | Best for | Cost |
|---|---|---|---|
| Coinglass | HL API + CEX aggregates, modelled leverage | Cross-exchange heatmap, long-term history | Free tier; Pro for more history |
| HyperDash | Real HL positions, per-wallet | Precise HL map, whale contributors, per-coin | Free |
| Hypurrscan | On-chain events | Verifying liquidations after the fact | Free |
| Hyperliquid app | Live trade feed, OI, funding | Real-time confirmation while trading | Free |
| Custom (API) | clearinghouseState, metaAndAssetCtxs |
Your own map, alerts, backtests | Free (rate limited) |
Bottom line
You get an edge most CEX traders never have: because every position's liquidation price on Hyperliquid is public, the Hyperliquid heatmap on Coinglass or HyperDash is a real census of leverage, not a statistical guess. Read bright bands as magnets and reaction zones, keep your stops and your own liquidation price outside them so a sweep cannot take you out, and treat a build-up on one side as a fragility warning rather than a timing signal, as October 10, 2025 proved. Pair the map with hourly funding and OI, remember its blind spots, and size positions so that a sweep is survivable. Start by pulling up the BTC heatmap next to the Hyperliquid app and watching one full session before you trade off it.
Frequently Asked Questions
What is a Hyperliquid liquidation map?
A Hyperliquid liquidation map is a chart that estimates, for each price level, how much leveraged position value would be force-closed if price reached that level. Tools such as Coinglass and HyperDash build it from Hyperliquid's open interest, leverage distribution and, for Hyperliquid specifically, the public positions of every wallet. Bright bands mark clusters of liquidation prices.
Liquidation map là gì?
Liquidation map (bản đồ thanh lý) là biểu đồ ước tính lượng vị thế đòn bẩy sẽ bị thanh lý tại từng mức giá. Trên Hyperliquid, dữ liệu vị thế là công khai nên bản đồ chính xác hơn so với sàn tập trung. Xem thêm hướng dẫn đòn bẩy và thanh lý trên Hyperliquid.
Is the Coinglass Hyperliquid heatmap accurate?
More accurate than its CEX heatmaps, because Hyperliquid positions and liquidation prices are on-chain and readable, whereas Binance or Bybit heatmaps are modelled from aggregate open interest. It still has limits: traders add margin, move stops and hedge on other venues, and the map cannot see positions on exchanges it does not index.
How do I use a liquidation heatmap for entries?
Treat dense clusters as magnets and as reaction zones. Many traders wait for price to sweep a cluster, watch for the liquidation cascade to exhaust, then enter in the opposite direction with a stop beyond the cluster. Place your own stop outside the densest band so a routine stop hunt does not take you out. Never trade on the heatmap alone.
Where can I see Hyperliquid liquidations in real time?
Coinglass (Hyperliquid liquidation map and heatmap), HyperDash (liquidation map plus whale positions), Hypurrscan (on-chain liquidation events), the Hyperliquid trade feed in the app, and Telegram or X bots that post large liquidations. Our whale tracker guide compares the tools.
What happened on Hyperliquid on October 10, 2025?
A sudden crypto-wide crash triggered record liquidations across all exchanges. Hyperliquid processed more than $10 billion in notional liquidations in a day, auto-deleveraging kicked in on some markets, and the chain stayed online. Heatmaps that day showed price cutting through cluster after cluster in minutes, a textbook liquidation cascade.
Ready to trade on the Hyperliquid app?
Open the official Hyperliquid DEX with our referral link and get a lifetime 4% discount on trading fees. No KYC, no gas fees, self-custody.
Open Hyperliquid App · Save 4%SIXPROSPERPaste the code in the referral field when you sign up (it must be applied before your first trade).
Disclaimer: This article is for educational purposes only and is not financial, investment or legal advice. Perpetual futures trading with leverage carries a high risk of loss. Read our full disclaimer.